As I continue with my PhD, I am always seeking out science communication opportunities and ways to engage people other than just scientists in my work. It is so incredibly important to make sure that scientific ideas burst out of the academic bubble that they are too often kept. I strongly believe that by dedicating time to outreach and scientific communication, we include new perspectives, consider new vantage points, and make our voices heard by all. Not to mention, it can be heaps of fun!
Podcast interview with the British Ecological Society
I had the opportunity to speak with Amelia Macho at the British Ecological Society about my recent publication in Functional Ecology titled ‘Why are trees hollow? Termites, microbes, and tree internal stem damage in a tropical savanna’.
This was my first experience recording a podcast, and I found it to be a great way to explain both the findings and the story behind a research paper. I would definitely do this again! Check out the recording on Spotify or Soundcloud.
Art science installation at SPARK Festival
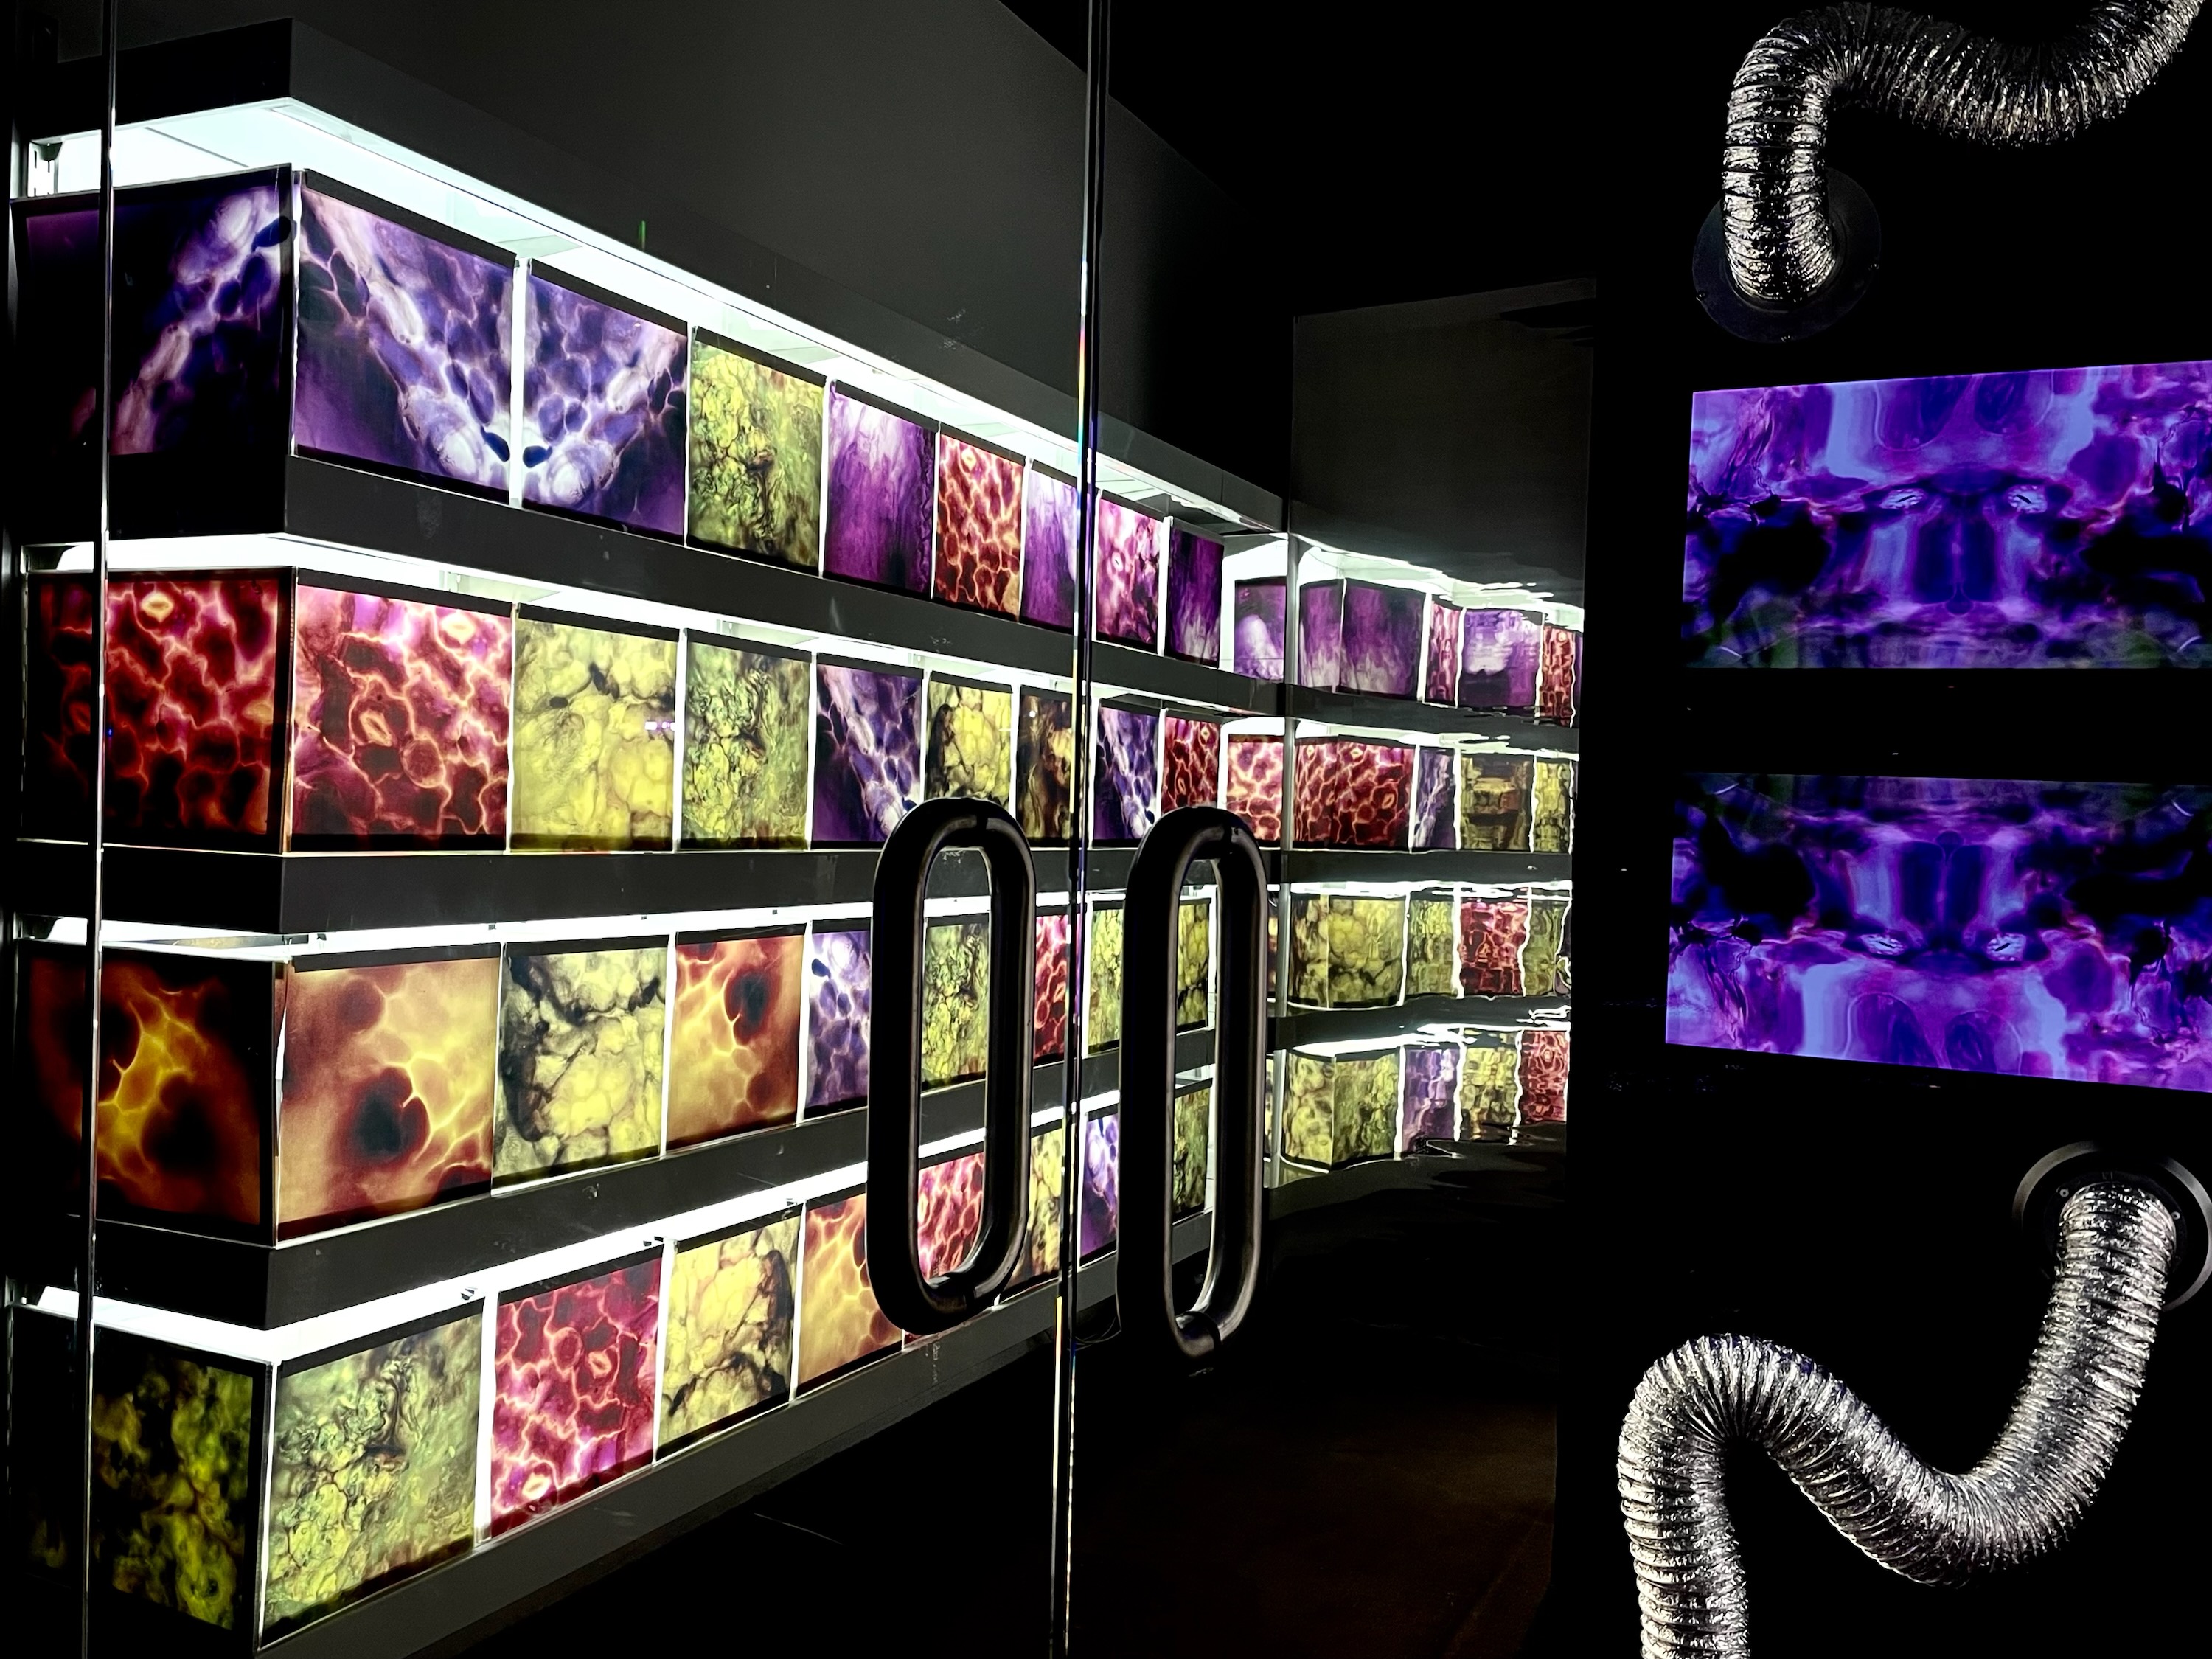
Working with artist Donna Davis, I had the opportunity to co-create an art installation exploring the fluxes and flows of carbon throughout the natural and human worlds. As part of Inhabited Ipswich, our work titled The Carbon Store: Gas Exchange creatively explores the hidden world of carbon in some of its many varied forms. Playing between science-fiction and science-fact, we communicate the dichotomy of carbon in nature, and carbon that humans refine; removing carbon from its reciprocal setting and exploring the idea of carbon as a retail commodity, and in this case in a shop in Ipswich, QLD. Nature provides so much for us, however, we rarely stop to ask; what is the cost of consuming her resources or how we can repay her in return…
Find full information on the installation and event here, and follow @eco_art_collective for more science facts and fun!
Interactive data visualization
For the fall 2022 semester I am learning interactive data visualization concepts in a web environment with Prof. Vinicius Sueiro. In the course, we are using three different exercises to explore interactive data viz: input, exploratory, and explanatory visualizations. I am learning HTML, CSS, and Javascript with the ultimate goal of elevating my dissertation research communication skills to a creative new level.
In our first project on input visualizations, I created an interactive bracket where users choose their favorite animal throughout a series of ‘battles’ (which was inspired by the famed March Mammal Madness, a collaborative scicomm initiative from researchers at ASU). I learned many basics in web styling via CSS, page building in HTML, and included interactive elements (click and drag features, recording and retrieving stored data, etc.) by incorporating Javascript.
Although rudimentary in function and styled for the early 2000’s, I’m proud of my interactive bracket titled ‘Animal Time’, so do have a go at selecting your favorite animal and contributing to the growing dataset here! (And be on the lookout for a Animal Bracket 2.0, likley to feature exclusively termites…)
Science communication and infographics
In the spring of 2022 I began to learn about the magic of using infographics as a data visualization technique. In a course taught by the inspirational Alberto Cairo in the Journalism department at the University of Miami, I have been building skills in data viz and Adobe programs to ultimately explore how infographics can communicate scientific data in distilled yet aesthetic ways.
Check out my two main projects for the course below:
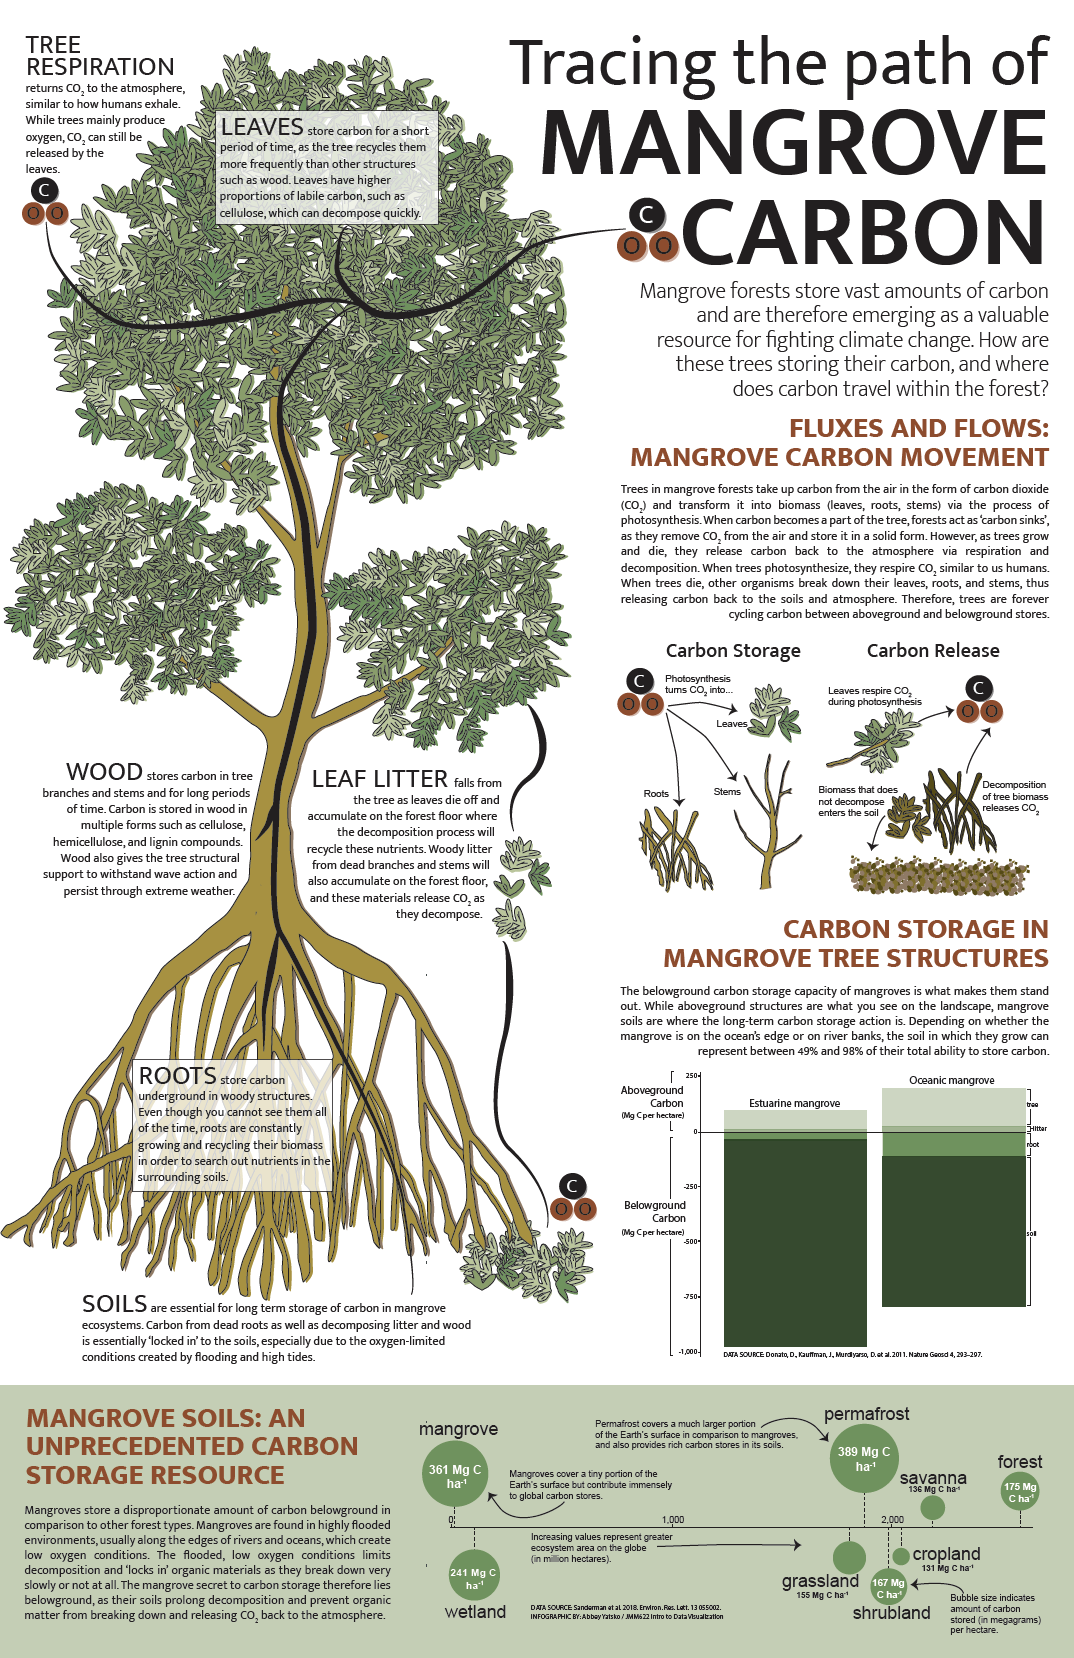
In Project 1, Tracing the path of MANGROVE CARBON, I illustrate how carbon cycles in a mangrove forest and how the mangrove ecosystem is a vital element in global carbon storage. Mangroves provide important habitat for organisms in the intertidal zone, protect shorelines from erosion and storm surges, and are also a key resource for storing carbon, which has relevant implications for global climate change.
 Download the infographic PDF here!
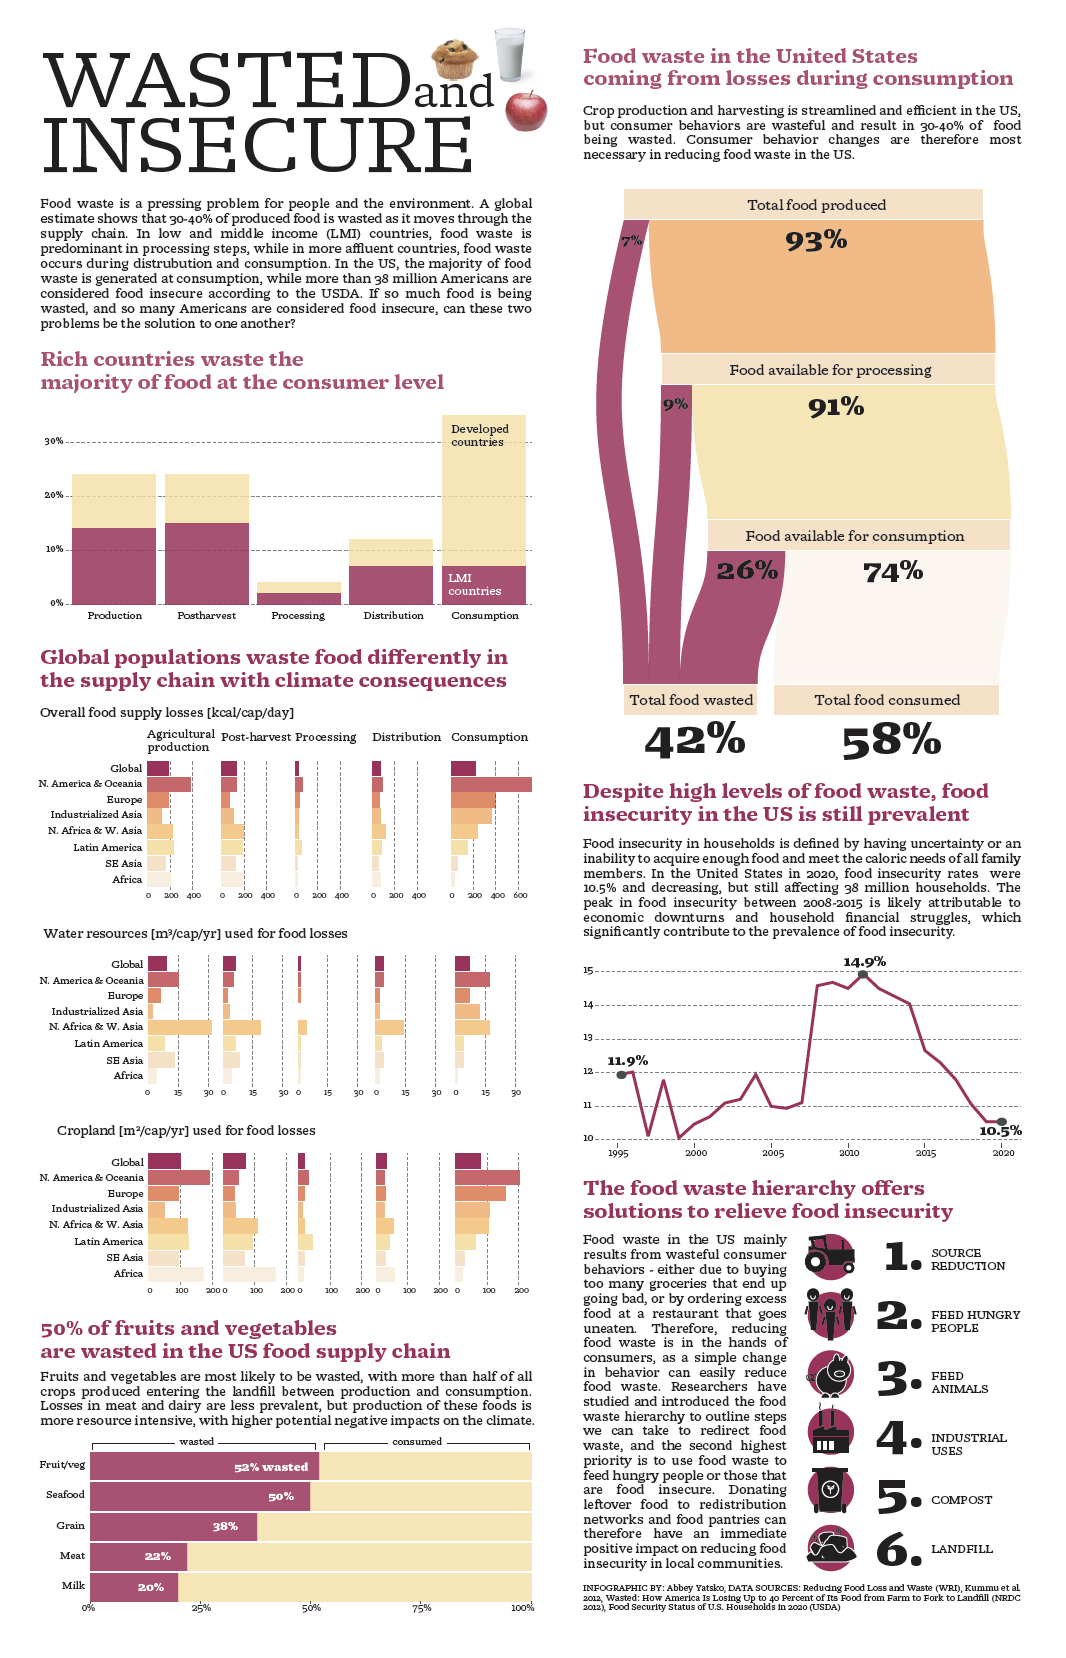
In Project 2, Wasted and Insecure: an exploration of overlaps in food waste and household food insecurity I explore food waste within a global context, and then narrow down to focus on food waste in the US and how food insecurity is happening simultaneously. The infographic illustrates how food waste happens at different parts of the supply chain, and how these loses depend on where in the world you are. By focusing on food waste dynamics in the US, which are largely on behalf of consumer decisions, I presented food waste challenges as a potential opportunity to address food insecurity in our country. In some sense, food waste and food insecurity are complementary problems, as they can serve as each other’s solutions.
 Download the infographic PDF here!
Environmental Careers day at the Fairchild Tropical Botanic Garden
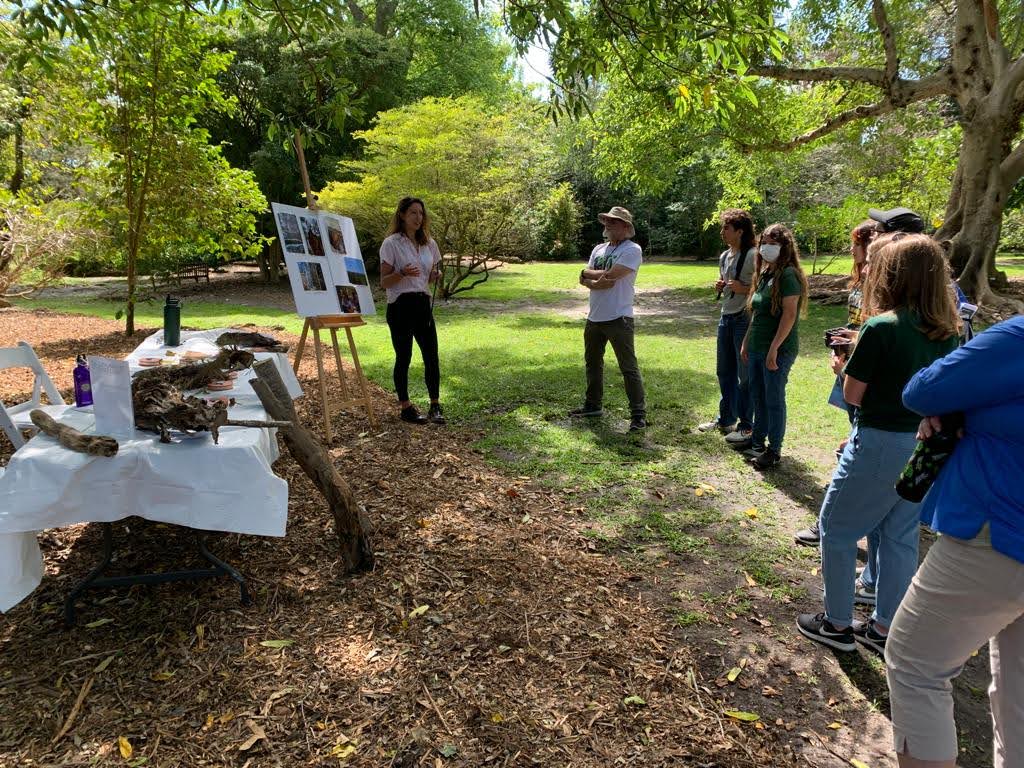
Amy and I had the unique opportunity to speak with grade school student from Miami-Dade county about what life is like as a research scientist. We showed pictures of the places we travel in order to study decomposition and carbon cycling. The students were really knowledgeable about decomposition, and I found it surprising how many students knew that termites produced methane!
What’s your termite twin? Take the quiz to find out!
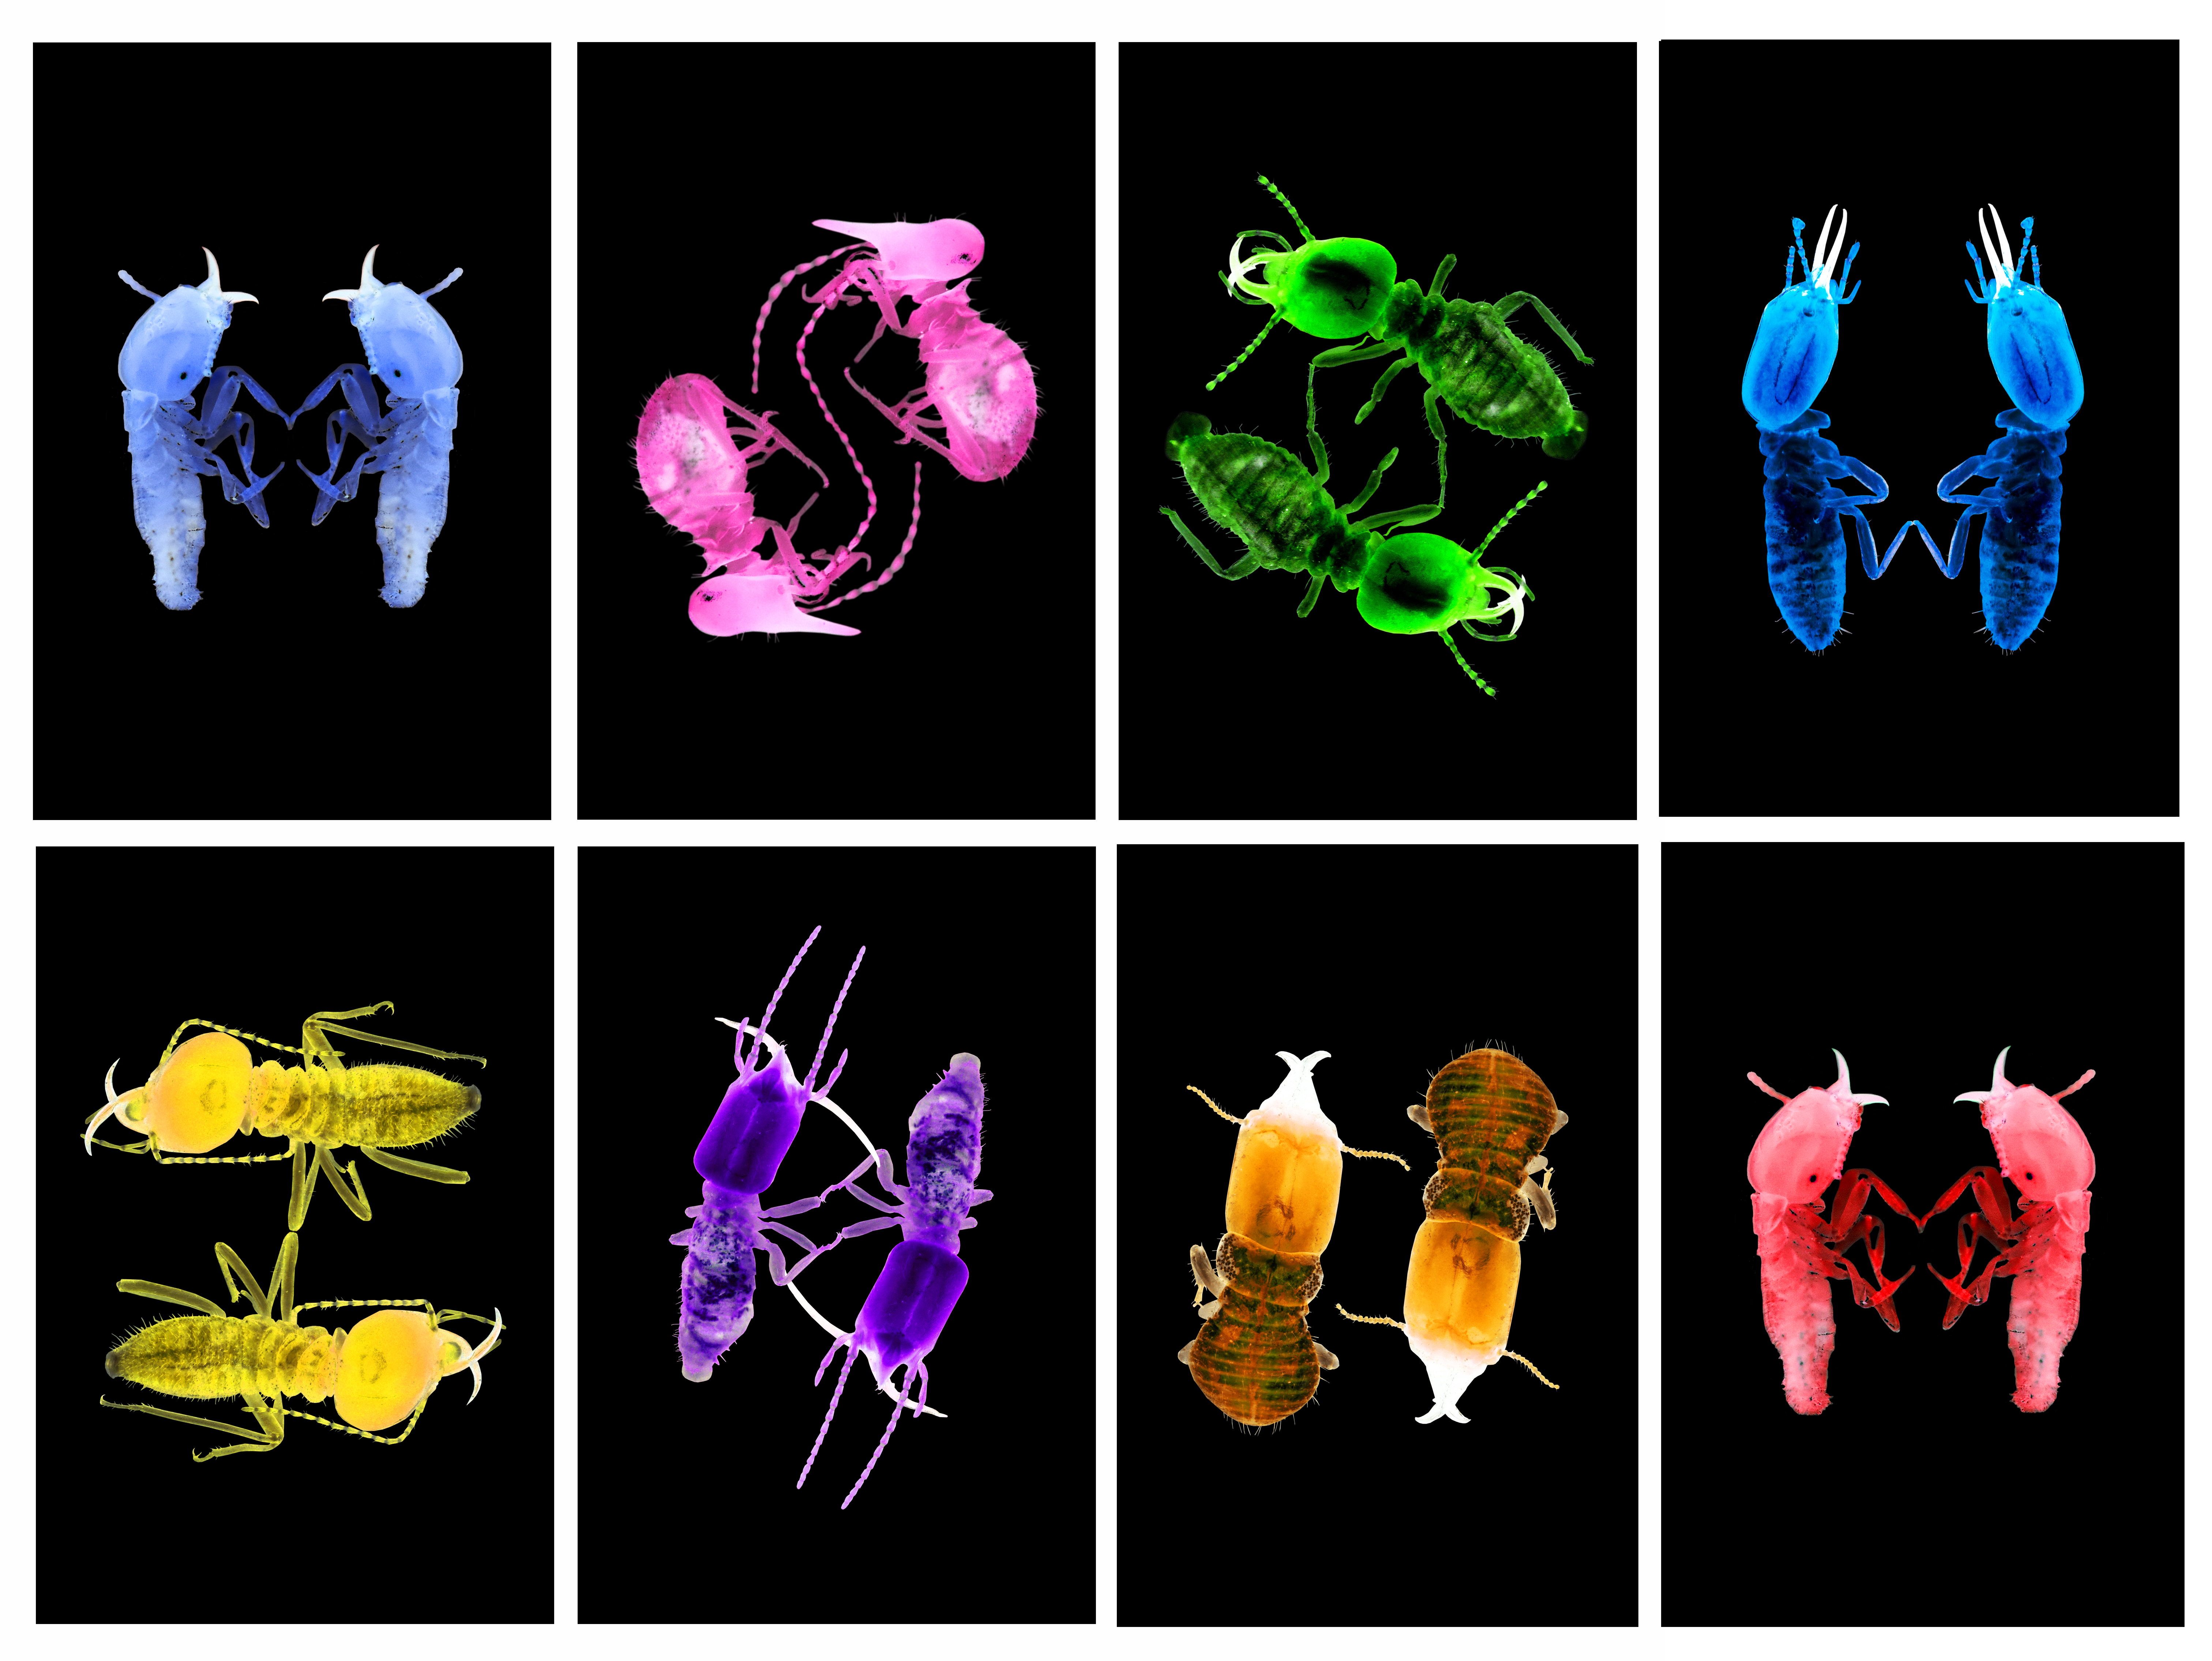
Most recently, Becca and I created a Buzzfeed quiz that determines which termite best represents your personality. We worked together with our termite reading group to make the descriptions and quiz outcomes as accurate as possible, so you are sure to find your true termite twin. Many thanks go out to members of the termite reading group, members of the Zanne lab, and Donna Davis (credit for the above photo) for their photo contributions to the quiz.
Take the quiz here to discover your true termite token!
Connecting with Cornell undergraduates on a climate change minor panel.
At the end of April, I had an opportunity to speak to Cornell undergraduates about my experiences with the climate change minor from my time as a student, as well as how the minor lead into a climate change-focused career. It was great to speak as a recent alumni and offer advice from the academic / PhD track perspective to students interested in the intersection of climate change and earth systems reasearch.